 in
the Key
Performance Indicators Panel.
in
the Key
Performance Indicators Panel.Tip: Each time you open a Compare View chart, a new sub-panel for the chart opens in the Content View Panel. You can scroll to see all of the open KPI charts.
Executive Console - SnapShot Compare Window
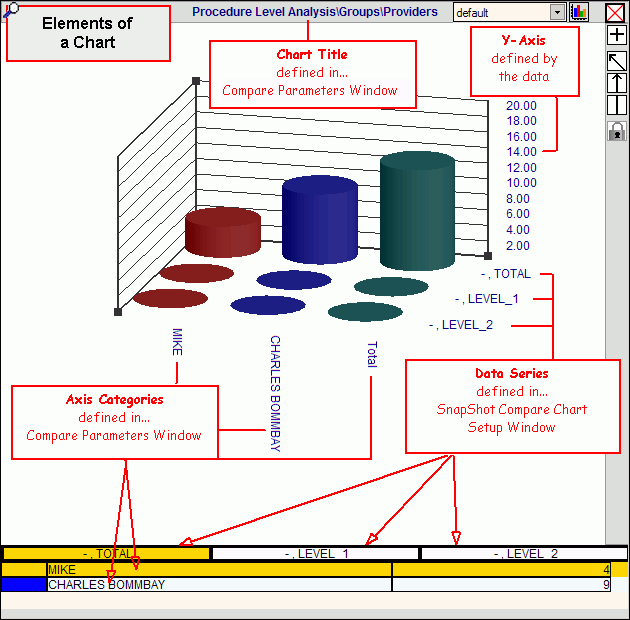
Use the SnapShot Compare Window to display an existing chart for a Compare View in a separate window from the Content View Panel. The table following the window example describes the SnapShot Compare Window for the Executive Console.
For additional information, click More.
Tips:
This window does not display ad hoc charts. The chart must already have an assigned Compare View Name to be displayed in the SnapShot Compare Window.
For more information about charts, see the Executive Console - Understanding Charts topic.
For information
about specific KPIs for an application, see the Key Performance
Indicators topic.
Tip: This
topic requires Internet access and the Adobe
Reader.
For more information about working with KPI reports, see the Executive Console - How To... topic.
For more information about working with data in fields, see the Data Entry Guidelines.
Directions:
To display the SnapShot Compare Window:
1. Open the Executive Console.
2. Click
Compare View  in
the Key
Performance Indicators Panel.
Tip: Each
time you open a Compare
View chart, a new sub-panel for the chart opens in the Content
View Panel. You
can scroll to see all of the open KPI charts.
3. Click
a KPI.
Tip: You
may have to click Plus ![]() to open one or more headings before revealing
a specific KPI. To
close heading levels, click Minus
to open one or more headings before revealing
a specific KPI. To
close heading levels, click Minus ![]() .
.
4. In
the Content View Panel, select a Compare
View Name in the drop-down list.
Example:

5. Click
Chart  to display
the chart.
Tip: You can also display an additional SnapShot Compare Window from within an open SnapShot window.
SnapShot Compare Window Example:
Tip: Using a chart in the SnapShot Compare Window is the same as using a chart in the Content View Panel.

|
SnapShot Compare Window Prompts Tip: To see more information about a field, click the hyperlink for the field name. |
|
|
|
Search: Opens the Compare Parameters Window, where you can define Compare Views for charts. |
|
Compare View Name |
To display a chart for another existing Compare View (in the SnapShot Compare Window): 1. Click
one of the Compare View Names in the drop-down list. 2. Click
Chart |
|
|
Chart: Displays another chart in the SnapShot Compare Window for the specified Compare View Name. |
|
|
Close: Closes the window. |
|
|
Show Totals: A toggle-style button.
|
|
|
Standard View: Returns to the standard three-dimensional (3D) view after clicking one of the other chart view buttons. |
|
|
Direct View: Flattens the displayed chart to two dimensions for a single Data Series. Tips:
|
|
|
Side View: Flattens the displayed chart to two dimensions for a single Category. Tip: To view a different Category, click the Category detail in the Chart Legend. |
|
|
Lock:
|
|
Rotation |
To rotate the chart, 1. If
the chart is locked, unlock it by clicking Locked
2. Point to one of the small square handles. 3. Hold the left mouse button down. 4. Drag the handle in a circular motion in either direction - clockwise or counter-clockwise. 5. When
you are satisfied with the rotation results, release the left mouse button. Tip:
To return
to the original orientation, click Standard
View |
|
Chart Legend |
The Chart Legend allows you to focus on specific Data Series and Category values in the chart. To change the chart to display a specific axis value, click a legend Data Series (heading) or Category (detail). Example:
|