 in
the Key
Performance Indicators Panel.
in
the Key
Performance Indicators Panel.Tip: Each time you open a Compare View chart, a new sub-panel for the chart opens in the Content View Panel. You can scroll to see all of the open KPI charts.
Executive Console - Compare Parameters Window
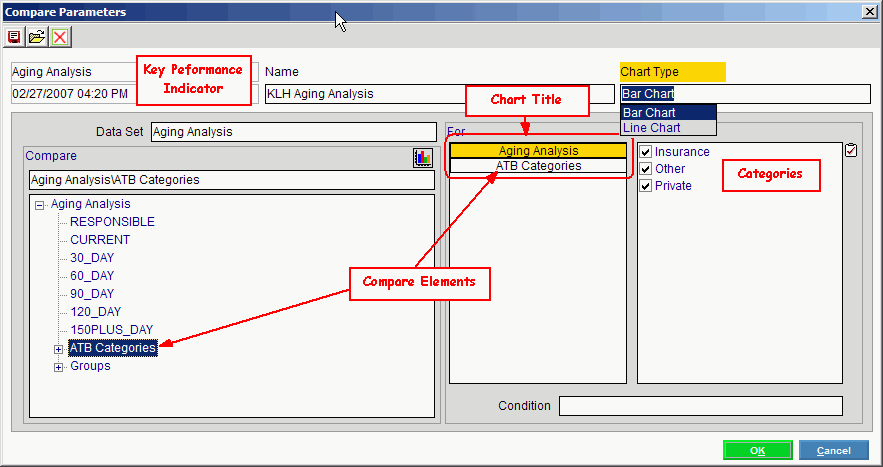
Use the Compare Parameters Window to define the parameters for a Compare View, which is a defined view for a chart. It allows you to graphically compare key performance indicator (KPI) data in a bar chart or a line chart. You can define a temporary Compare View, or you can save the definition for reuse by assigning a Compare View Name to the definition. The table following the window example describes the Compare Parameters Window for the Executive Console.
For additional information, click More.
Tips:
For more information about charts, see the Executive Console - Understanding Charts topic.
For information
about specific KPIs for an application, see the Key Performance
Indicators topic.
Tip: This
topic requires Internet access and the Adobe
Reader.
For more information about working with KPI reports, see the Executive Console - How To... topic.
For more information about working with data in fields, see the Data Entry Guidelines.
Directions:
To display the Compare Parameters Window:
1. Open the Executive Console.
2. Click
Compare View  in
the Key
Performance Indicators Panel.
Tip: Each
time you open a Compare
View chart, a new sub-panel for the chart opens in the Content View
Panel. You
can scroll to see all of the open KPI charts.
3. Click
a KPI.
Tip: You
may have to click Plus ![]() to open one or more headings before revealing
a specific KPI. To
close heading levels, click Minus
to open one or more headings before revealing
a specific KPI. To
close heading levels, click Minus ![]() .
.
4. To display the Compare Parameters Window:
Click
Search ![]() in
the Content View Panel.
in
the Content View Panel.
Or, click Search in the SnapShot Compare Window.
To define a Compare View for a chart:
1. To
modify an existing view, click Open  and select
the view that you want to change.
Tip: Skip
this step if you are creating a new view, whether temporary (ad hoc) or
permanent.
2. Fill
in the rest of the Compare Parameters.
Tip: You
can skip the Name if you want, for now.
3. To
display the SnapShot
Compare Chart Setup Window, click Chart
 .
.
4. Define
the settings, and then to return to the Compare Parameters window, click
OK  .
.
5. If
you want to save the Compare View definition for future use, enter the
Name
and click Save
 at the Compare Parameters Window.
6. To
display the chart in the Content
View Panel, click OK at the
Compare Parameters Window.
Tip: You
can alternatively display the chart in the SnapShot
Compare Window.
To delete an existing Compare View:
1. Click
Open  and select the view
that you want to delete.
2. Click
Delete  .
.
Compare Parameters Window Example:

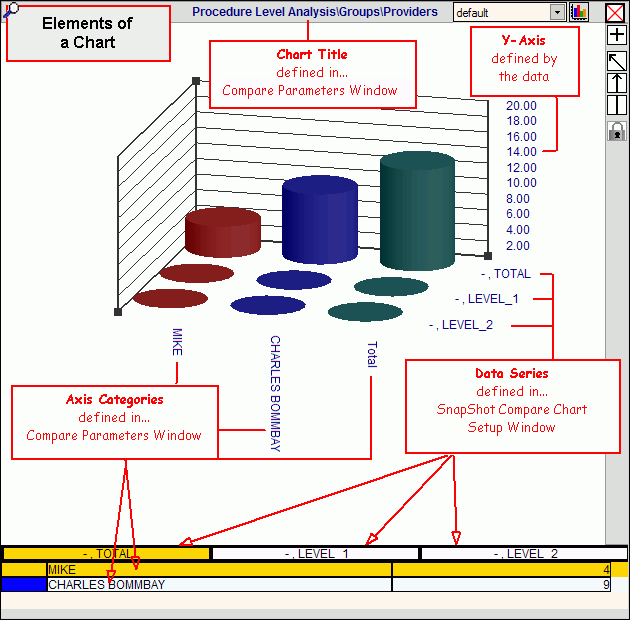
Tip: To see a diagram of the elements of a chart, click More.

|
Compare Parameters Window Prompts Tip: To see more information about a field, click the hyperlink for the field name. |
|
|
|
Saves a Compare View definition for reuse later. Tip: Name is required when you save the Compare View. |
|
|
Opens an existing Compare View for a chart. |
|
|
Deletes the currently displayed Compare View. |
|
Displays information about the open KPI. | |
|
Enter the KPI Compare View Name, if you want to save the chart's definition. (unlimited characters) Tips:
| |
|
To create either a bar chart or a line chart for the open KPI, click one of the KPI Chart Types in the drop-down list. (predefined) | |
|
To specify the major level of data for the chart's Compare View, click one of the KPI Data Sets in the drop-down list. (predefined for the KPI) | |
|
A KPI Compare Element is a sub-set of nested data groupings within a Data Set. The Compare Elements show the structure of the data that you have selected for the Compare View. Click one or more elements to include in the chart. (predefined for the KPI) Tip: As you select elements, you can see them listed in the "For" column. | |
|
|
Chart: Displays the SnapShot Compare Chart Setup Window, where you can select the Data Series for the chart's multiple X-axes. Notes:
|
|
For |
You can further refine the compare values by specifying which Categories within each Compare Element you want to include in the chart. Example: For the ATB Categories Compare Element:
Tips:
|
|
You can define conditions that the data must meet to be included in the chart. (unlimited characters) Tip: For more information about condition syntax, refer to the Understanding Conditional Syntax topic. | |
|
|
To display the chart in the Content View Panel, click OK. Keyboard shortcut: [ALT + o] Note:
Make sure
you first click Chart |
|
|
To cancel the setup of Compare Parameters, click Cancel. Keyboard shortcut: [ALT + k] |